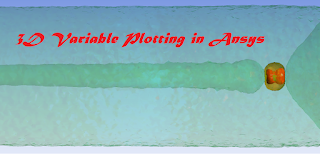
A very interesting option in post-processing in Ansys is the generation of 3D distributions that can be easily done using the IsoSurfaces function. We can distribute any variable by defining ranges of values of different sizes. The entire graphic design of the generated distribution also depends on us. When it comes to IsoSurfaces, we have a very wide range of modular possibilities with this function.
 |
| Velocity 3D Distribution of Bullet Fly |
The first step is to select the IsoSurfaces function in postprocessing. To do this, right-click on User Locations and Plots and select IsoSurfaces. The Details of IsoSurfaces window will appear in which we select the model element (Domains) where we plot our 3D distribution, the variable selection field and the range of values to be displayed. You can see these functions below (Geometry tab).
 |
| IsoSurface function (Geometry Tab) in Ansys Postprocessing |
On the next tab (Render), we can precisely define the graphic properties of our 3D plots. Transparency function is very useful when we put several IsoSurfaces on each other because thanks to this option we can modulate the transparency of subsequent layers. As in the first picture in this post, we have superimposed several speed ranges on each other and using the Transparency function we are able to present all generated IsoSurfaces on one projection.
Other functions like Lighting (green frame) and Apply Texture (blue frame) are used for visual processing of our generated 3D layouts. Below you can see how these functions affect the visual appearance of IsoSurfaces.
 |
| Other graphical functions of IsoSurfaces - Render Tab - Ansys Postprocessing |
The next View tab is especially helpful for generating images of complete models from geometries simplified by symmetry or linear / circular periodicity.
 |
| View Tab for generating complete geometry - Ansys Postprocessing |
Defining the colors of our IsoSurfaces is also a very important function. We will perform this option in the Color tab. We can set a constant color of our 3D distribution or adjusted to the value ranges of our variable (Use Plot Variable). The solid color is extremely helpful for us when we are dealing with many layers of IsoSurfaces.
 |
| Color of IsoSurfaces - Color Tab - Postprocessing in Ansys |
Below you can see the temperature distributions shown with IsoSurfaces from previous blog posts. Of course, we do not have to limit ourselves only to temperature or speed as our variable. In fact, the presentation of the results depends only on us because we have very wide possibilities offered in the Ansys software.
 |
| 3D Temperature Distributions in Room from previous posts - Ansys Postprocessing If U want to read more tips or tutorials for example go to Radiator Game below : |

No comments:
Post a Comment